
On this page
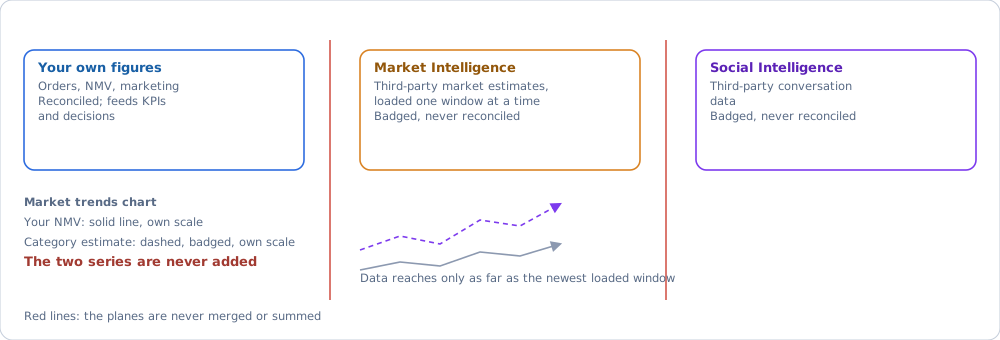
In short. Third-party estimates about a market and third-party conversation data about a brand, each on its own plane and badged as an estimate. They are never added to the organization's own figures.
How it works#
Two plugins provide these screens, Market Intelligence and Social Intelligence. Both are off by default; a super admin enables each one per organization.
| Rule | Mechanism |
|---|---|
| Every figure is badged as a third-party estimate | A badge on each card; estimates never enter first-party KPIs or decisions |
| Own and estimated series share a chart, never a sum | Two scales; the organization's NMV is drawn beside the estimate |
| Granularity follows the source | TikTok Shop loads weekly, Shopee monthly |
| Off means off | With Market Intelligence off, the data assistant cannot reach market data |
| The provider stays a badge | The provider's name is a small source badge, never page content |
An estimate arrives as an export loaded on the Market data screen, one window at a time. Market trends draws the loaded windows beside the organization's own NMV and names the newest window, so you can see how far the estimate lags today.
Market Intelligence
| Screen | Route | Answers | Key measures |
|---|---|---|---|
| Market trends | / |
How is the category trending against us? | Estimated category revenue, own GMV/NMV, data lag |
| Competitor movement | / |
Who is leading, climbing, or falling? | Rank movement, watchlist |
| Market creators | / |
Which creators drive category sales? | Leading, accelerating, new-face creators; watchlist |
| Creator classification | / |
Is this handle a creator or a brand account? | Machine type, confidence, reasoning |
| Products & Opportunities | / |
Where is the whitespace, and what sells? | Whitespace, leading products, combos, price bands, launch velocity |
| Livestream | / |
How does the category sell live? | Leading sessions, GMV by session length, channel mix |
| Market data | / |
What is loaded, and on what basis? | Source, window, row count; own GMV/NMV basis |
Creator classification is a super-admin screen over the estimate plane. For an organization built around this plane, see Market Intelligence organizations.
Category report
A separate opt-in plugin, Category report (Báo cáo ngành hàng), reports one TikTok Shop category per industry the organization declares (for example infant and adult milk powder). Turning on Market Intelligence does not add these screens; an organization without the plugin gets a 404 on every route. Every screen shares one period picker (the full captured year or one month) and one industry control, carried in the URL and remembered per organization in the browser. A filter bar under the tabs adds brand, product form (powder by default), account type, shop type and search where the screen can apply them; a filter a block cannot apply is named in that block's footer. Livestreams and videos sit under one Content tab.
| Screen | Route | Answers | Key measures |
|---|---|---|---|
| Category overview | / |
How big is the category, and who is winning? | Top-product revenue by month, channel mix, brand share |
| Brands | / |
Which brands gain or lose share? | Brand league, share by month |
| Top products | / |
Which products, prices and bundles sell? | Product ranking, price bands, rank movement |
| Top creators | / |
Who sells: independent creators or seller accounts? | Creator ranking, months in the top 300, brands sold |
| Shops | / |
Do brands sell through brand shops or retailers? | Shop ranking by month, brand shops vs retailers |
| Top livestreams | / |
Which sessions and start hours earn revenue? | Sessions in scope, revenue by start hour, account type |
| Top videos | / |
Which videos sell, and how long are they? | Videos in scope, revenue by duration, share run with ads |
A creator row opens a profile at /market-intelligence/category/creators/<id>. Brand shares are estimated from product titles through the organization's own brand dictionary; the unidentified share is always shown apart. Livestreams and videos are a sample: at most each leading account's 100 highest-revenue items.
Social Intelligence
| Screen | Route | Answers | Key measures |
|---|---|---|---|
| Social listening | / |
How is the brand discussed this month? | Discussions, posts, comments, shares vs. prior month; platform split |
| Social trends | / |
What topics are most discussed right now? | Ranked topics, movement, topic mix, rank over time; 24-hour, 7-day or 30-day ranking with the Social trend feed, a 7/14/30-day window without it |
| Social — Overview | / |
What does the audience think about this product group? | 30-day momentum, 6-month trajectory, mentioned aspects |
Social trend feed
Social trends reads one ranking that MSO Cloud syncs once for every organization, instead of each organization's own spreadsheet rows. A super admin turns on the Social trend feed feature for an organization and may assign extra topics; without it the page keeps reading the organization's own rows. The ranking is a third-party estimate and the page says so.
With the feed on, the page shows:
- a window picker (24 hours, 7 days, 30 days), a topic picker (the general ranking plus the assigned topics) and a movement filter (rising, falling, steady);
- the ranking table with rank change, buzz, engagement and a recent-rank sparkline, then topic mix, rank over time and buzz against engagement;
- a detail panel per trend: figures by period, keywords, the top posts and the rank over time.
Trends the spam screen holds back appear only after a super admin approves them. When the feed has not synced yet, the page says the data is being updated.
Social — Overview needs market data for a product group. With none, it opens Social listening instead of an empty page. A delivered conversation corpus the client signs off is a different plane: see Content Intelligence.
What it reads#
| Reads | Never reads |
|---|---|
| Third-party market estimate exports loaded by the organization | The organization's orders, except as the labelled NMV overlay |
| Third-party social listening feeds and the shared trend feed | Marketing or CRM data |
| Watchlists and classifications the organization keeps | Another organization's data |
Where it stops#
Current rollout is on Project status (Market Intelligence) and Project status (social pages).
- Estimates sit outside the metric reconciliation gate: they are not the organization's numbers and are never reconciled against them.
- A ranking stops at the provider's capture depth. The long tail is cut, not estimated.