
On this page
In short. Four reports answer what the fixed retail dashboards do not: margin by brand, payout reconciliation, LIVE commerce across marketplaces, and who comes back. Each needs at least one marketplace connection; with none it has no data.
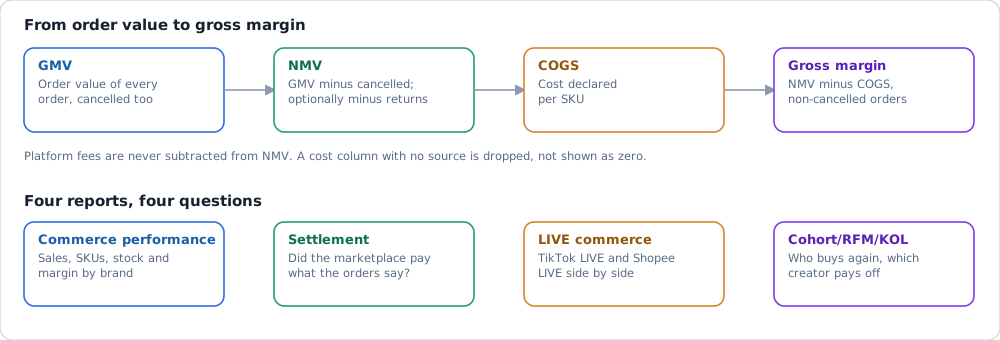
Which report#
| Question | Report | Route |
|---|---|---|
| Margin after COGS and creator or media cost, by brand | Commerce performance | / |
| Did the marketplaces pay what the orders say? | Settlement | / |
| How do TikTok LIVE and Shopee LIVE perform together? | LIVE commerce | / |
| Who buys again, and which creator is worth scaling? | Cohort/RFM/KOL | / |
One number for the whole organization, one marketplace alone, or a SKU or creator table: use the Retail report pack. One creator over time: Commerce operations. The shared filter bar defaults to the last 30 days in Vietnam time, with a compare-to-prior toggle, a Marketplace chip (one, or All) and a closed Advanced section (brand, category, SKU, creator, status).
How it works#
GMV, NMV and margin
GMV is the order value of every order. NMV sets cancelled orders to zero. The organization chooses whether NMV also subtracts returns, under Settings > Organization (NMV definition). The choice applies everywhere NMV appears: reports, Explore, dashboard widgets, the AI assistant and exports.
| NMV definition | NMV is |
|---|---|
| GMV minus cancelled orders (default) | The order value of every order that was not cancelled |
| GMV minus cancelled orders and returns | The same, minus returned orders in full and the refund the marketplace records |
Platform fees are never subtracted. Gross margin is NMV minus COGS in VND, over orders that were not cancelled. A cost column with no data source is dropped, never shown as zero, so gross margin appears only when COGS is known.
Commerce performance
Five measure groups on one page: Overall, SKU, Creator, Inventory and P&L.
| Block | Shows |
|---|---|
| Actual vs. target | Actuals by brand against the annual budget |
| Mix by marketplace, Sales by day | NMV donut; GMV by marketplace in stacked columns |
| Shopper segments | New and Returning shoppers, counted as distinct shoppers |
| Sales performance | Searchable SKU table: code, name, brand, quantity, GMV |
| Creator contribution and performance | Video vs. livestream; GMV, orders, cancellation per creator |
| Inventory | Stock value by brand and intended use; needs COGS |
| Gross margin (P&L) | NMV, promotion rate, then COGS and the cost columns that have data |
A shopper is New when the first order ever falls inside the range, Returning when it falls before. A shopper whose first order was in January reads as Returning in a May-only view. An order with no resolvable buyer counts toward GMV and orders but not toward segments. A brand with no budget hides only its target column. Export gives a PDF or an Excel workbook.
Settlement
Expected payout, computed from orders, sits beside the actual payout from marketplace statements.
The page shows four things: KPI tiles (Expected, Actual, Variance, Mismatched lines; prior period when comparing), charts (Payout by marketplace, Variance by day), an exception queue of lines to resolve before closing the books with order and batch id, and a Vietnam sale calendar with that day's GMV and orders.
LIVE commerce
TikTok LIVE and Shopee LIVE on one page, separate from the pack's Livestream performance. One measure mode applies to the whole period. With session data (viewers and cost) the tiles are Live GMV, Viewers, GMV per viewer and KOL ROAS. With affiliate-attributed orders only, they are Active creators, Affiliate GMV, Cancellation rate and Commission, and a banner says so. ROAS is never inferred from a zero viewer count.
Cohort, RFM and KOL
Shoppers are segmented by frequency, value and recency inside the selected period, not the full history.
| Segment | Rule |
|---|---|
| Champions | 5 or more orders and 8,000,000 VND or more |
| Loyal | 3 or more orders |
| At-risk | Last order more than 21 days before the period end |
| New / Nurture | Everyone else |
The KOL quadrant plots GMV against CAC, bubble size is order count. CAC here is creator cost (sample, fee, media) divided by orders attributed to that creator. The verdict is Scale when ROI is 100 % or more, Review when GMV is above 0, otherwise Pause. The repeat-rate cohort heat map counts shoppers still active at each month mark, not percentages.
What it reads#
It reads orders, order items and products with COGS; payout statements from the marketplace; and the creator cost, media spend and budgets the organization declared. It never reads third-party market estimates, social-listening data or another organization's data.
Where it stops#
Current rollout is on Project status.
- Settlement reconciles payout lines that exist; a period with none shows an empty state.
- Session-mode LIVE measures need viewer and cost data from the marketplace.