
On this page
In short. Seven screens answer the daily eCom questions: what sold, what is in stock, which creators sold, and whether data is flowing. All of them read the organization's own marketplace data for the selected brand.
The screens#
| Screen | Route | Answers | Key measures |
|---|---|---|---|
| Orders | / |
What sold in the period, and to whom? | Order value net of discounts, order count, AOV |
| Products | / |
Is the catalog clean and costed? | Active vs. discontinued, SKUs with COGS, undecodable SKUs |
| Inventory | / |
What is out, low or untracked? | Stock by SKU and warehouse, expiry |
| Creators | / |
Which creators sold most this period? | GMV, orders, impressions, clicks |
| Creator directory | / |
How does each roster creator perform over time? | GMV, NMV, cancellation, commission, content activity |
| Data pipeline | / |
Is data flowing from each connection? | Status, streams, last and next sync, rows processed |
| Mapping | / |
Do categories and shop codes line up by source? | Category and shop ID mappings |
How it works#
Orders share the date and marketplace filter with the report pages, in Vietnam time. An order opens to its products, status history, fee and payment detail where the marketplace supplies it, order type and buyer. Buyer name, phone, email and address are hidden; each field has its own reveal button.
Products is the catalog every report joins to, keyed by SKU and cost of goods sold (COGS). It counts active and discontinued products, SKUs with a declared COGS, categories corrected by hand, and SKUs whose code does not decode to a category or brand.
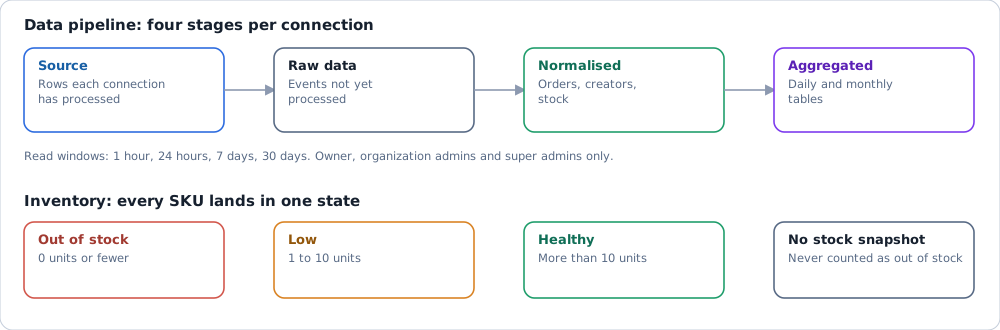
Inventory puts each SKU in one state: out of stock (0 or fewer units), low (1 to 10), healthy (more than 10), or no stock snapshot. A SKU with no snapshot is never counted as out of stock. The thresholds 0 and 10 are fixed. An expiry filter shows SKUs due within 30 or 7 days.
Creators ranks the period's creators by the GMV they generated. The directory holds one row per roster creator and filters by brand. Commission is a cost with its own columns and never merges into GMV or NMV. Follower count is context, never the ranking column. The directory shows no private messages.
Data pipeline shows four stages per connection: Source, Raw data, Normalised, Aggregated. A window selector (1 hour, 24 hours, 7 days, 30 days) sets the range of the row counts. It also shows failed jobs waiting for action, rows skipped during mapping, and a table of connections with last and next sync.
Mapping has two tabs shared by API and file-upload sources: Categories, and Shop ID (a shop code across sources). When a marketplace changes its export columns, fix the stream's mapping as described in Upload CSV or Excel files.
What it reads#
| Reads | Never reads |
|---|---|
| Orders, order items, products, stock snapshots | Third-party market estimates |
| Affiliate and creator feeds for the selected brand | Social-listening data |
| Connector run logs | Another organization's or brand's data |
Where it stops#
Current rollout of these screens is on Project status.
- Data pipeline and Mapping open only for the owner and organization admins (Data pipeline also for super admins). Other roles see an access-denied message. Mapping appears only when the marketplace pillar is active.
- Creator content columns need the marketplace's content feed; without it they stay empty.